
Leads
Leads
Every lead-form submission lands here, as a list or a drag-and-drop board.
Where
Leads
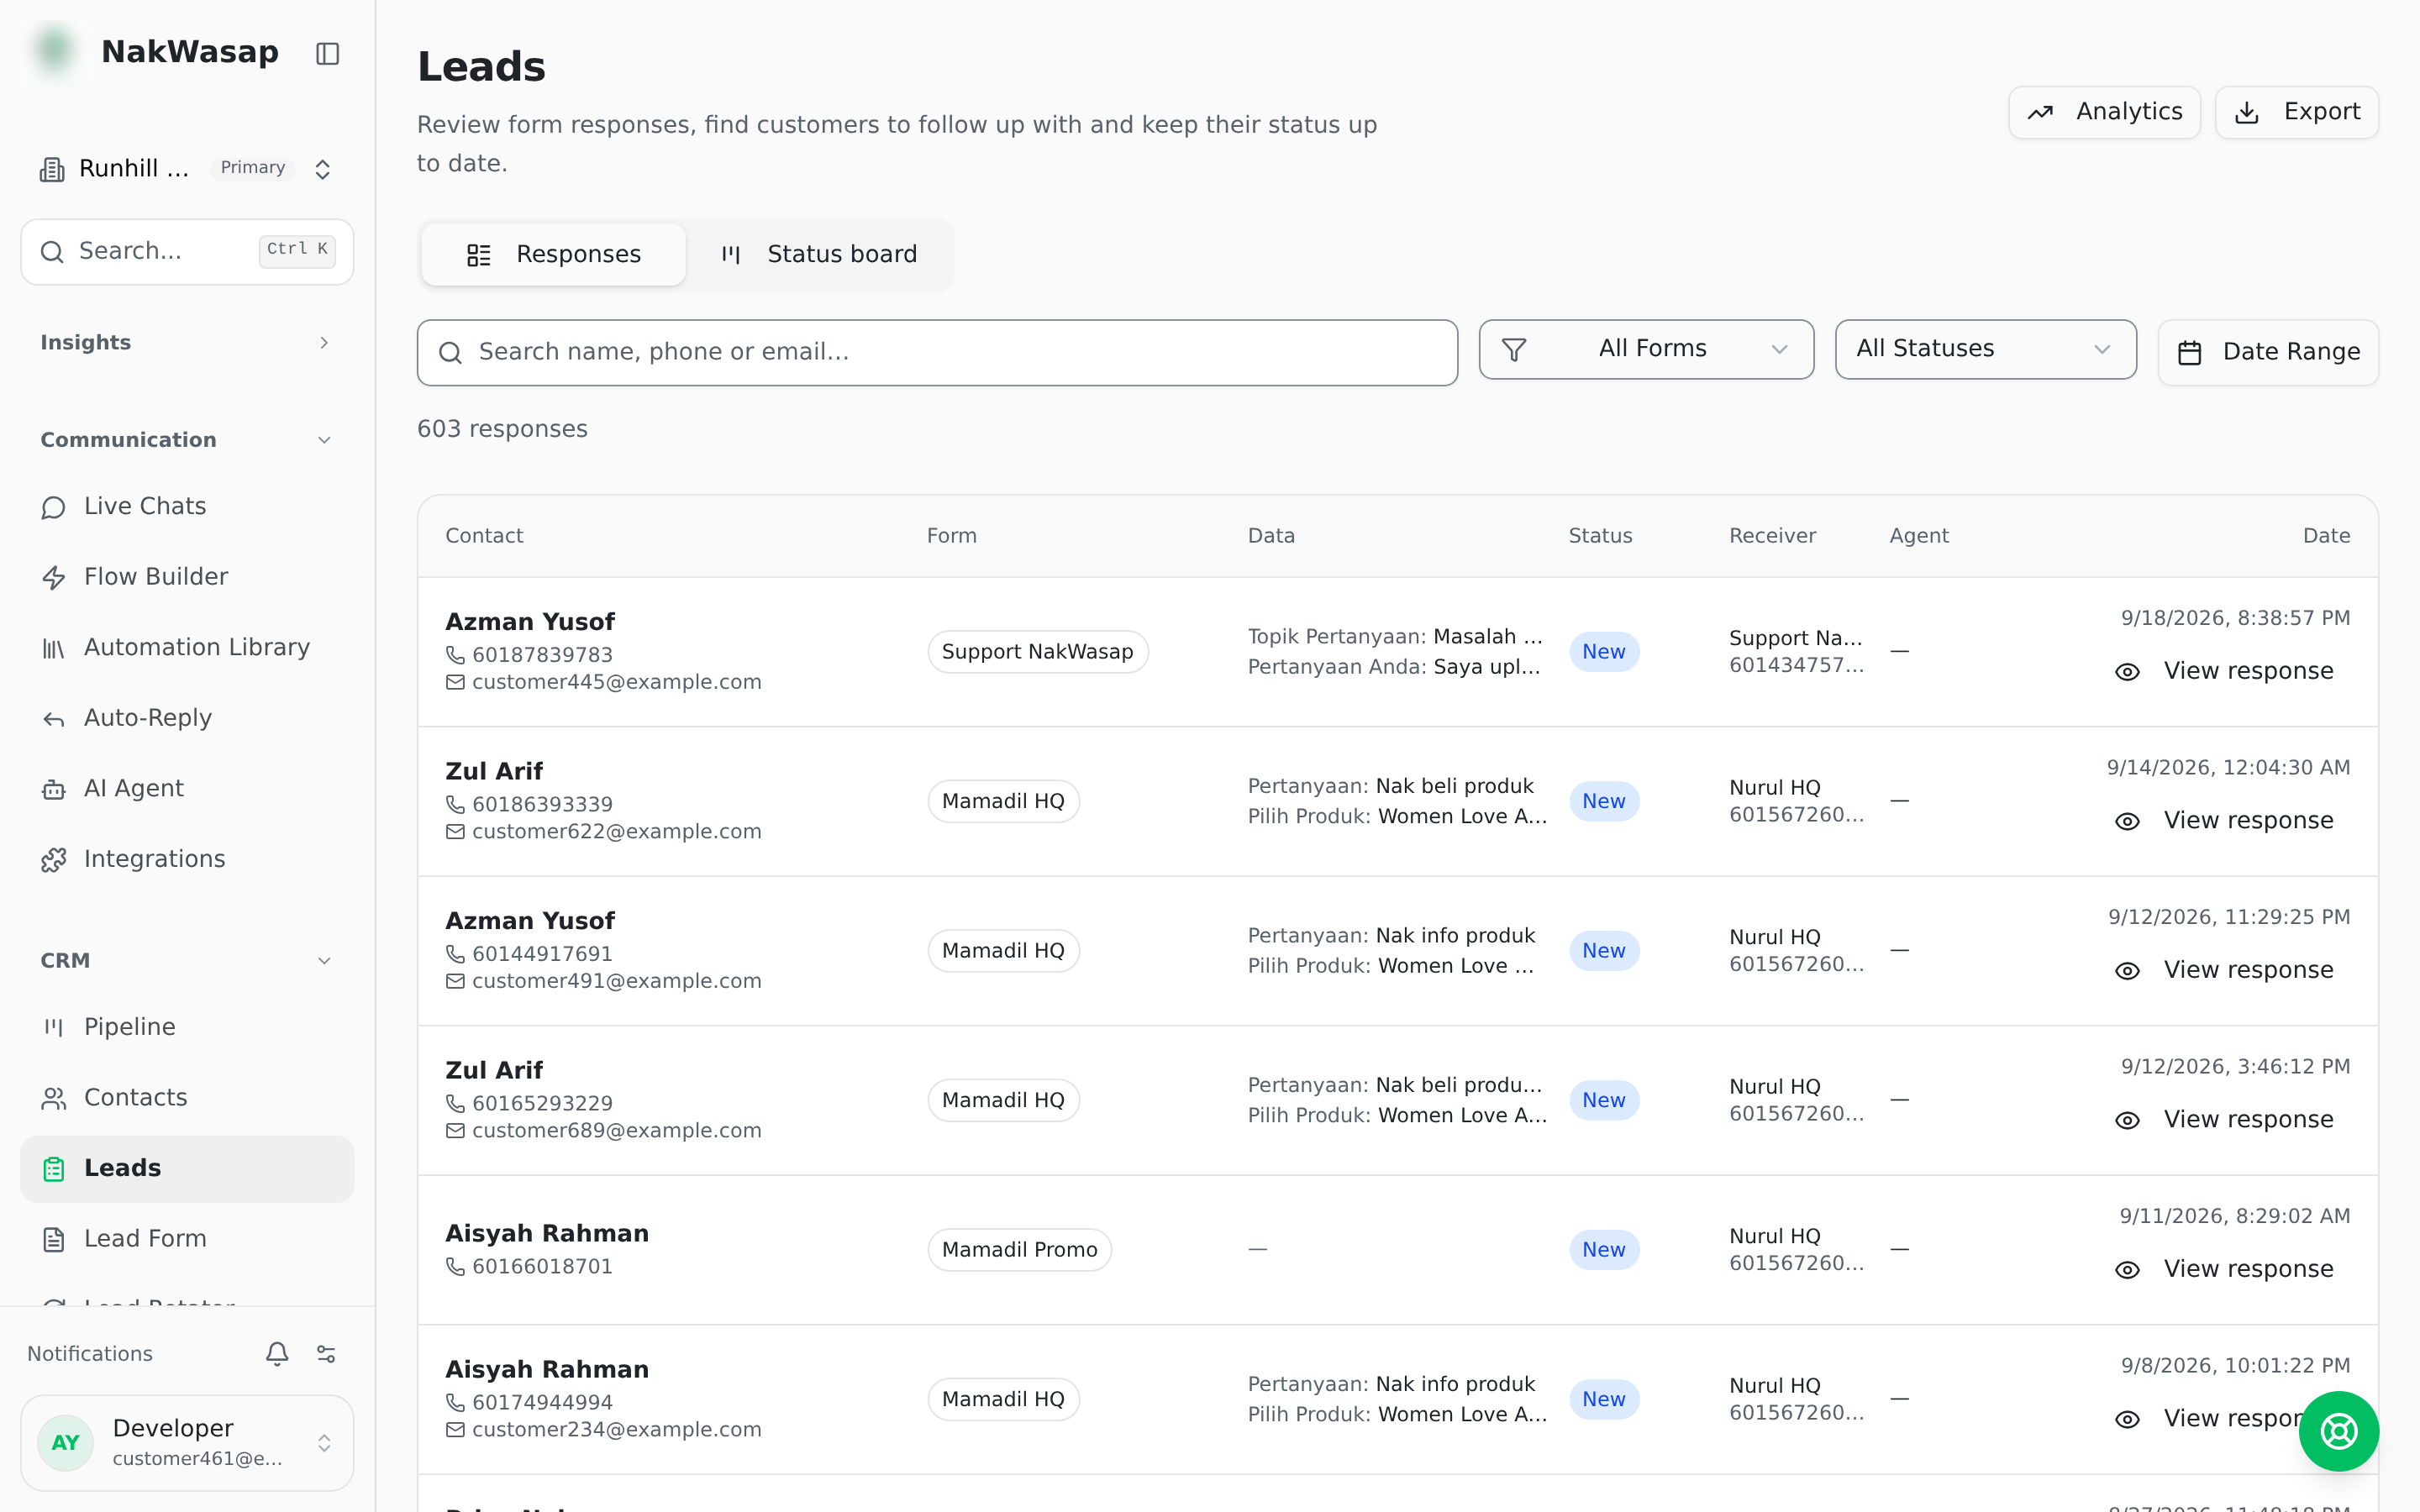
- —Drag a card to change its lead status
- —Filter by form, status and date range
- —Open any lead to see all its submitted field values
- —Export the full filtered set to CSV
Lead analytics
Where
Leads → Analytics
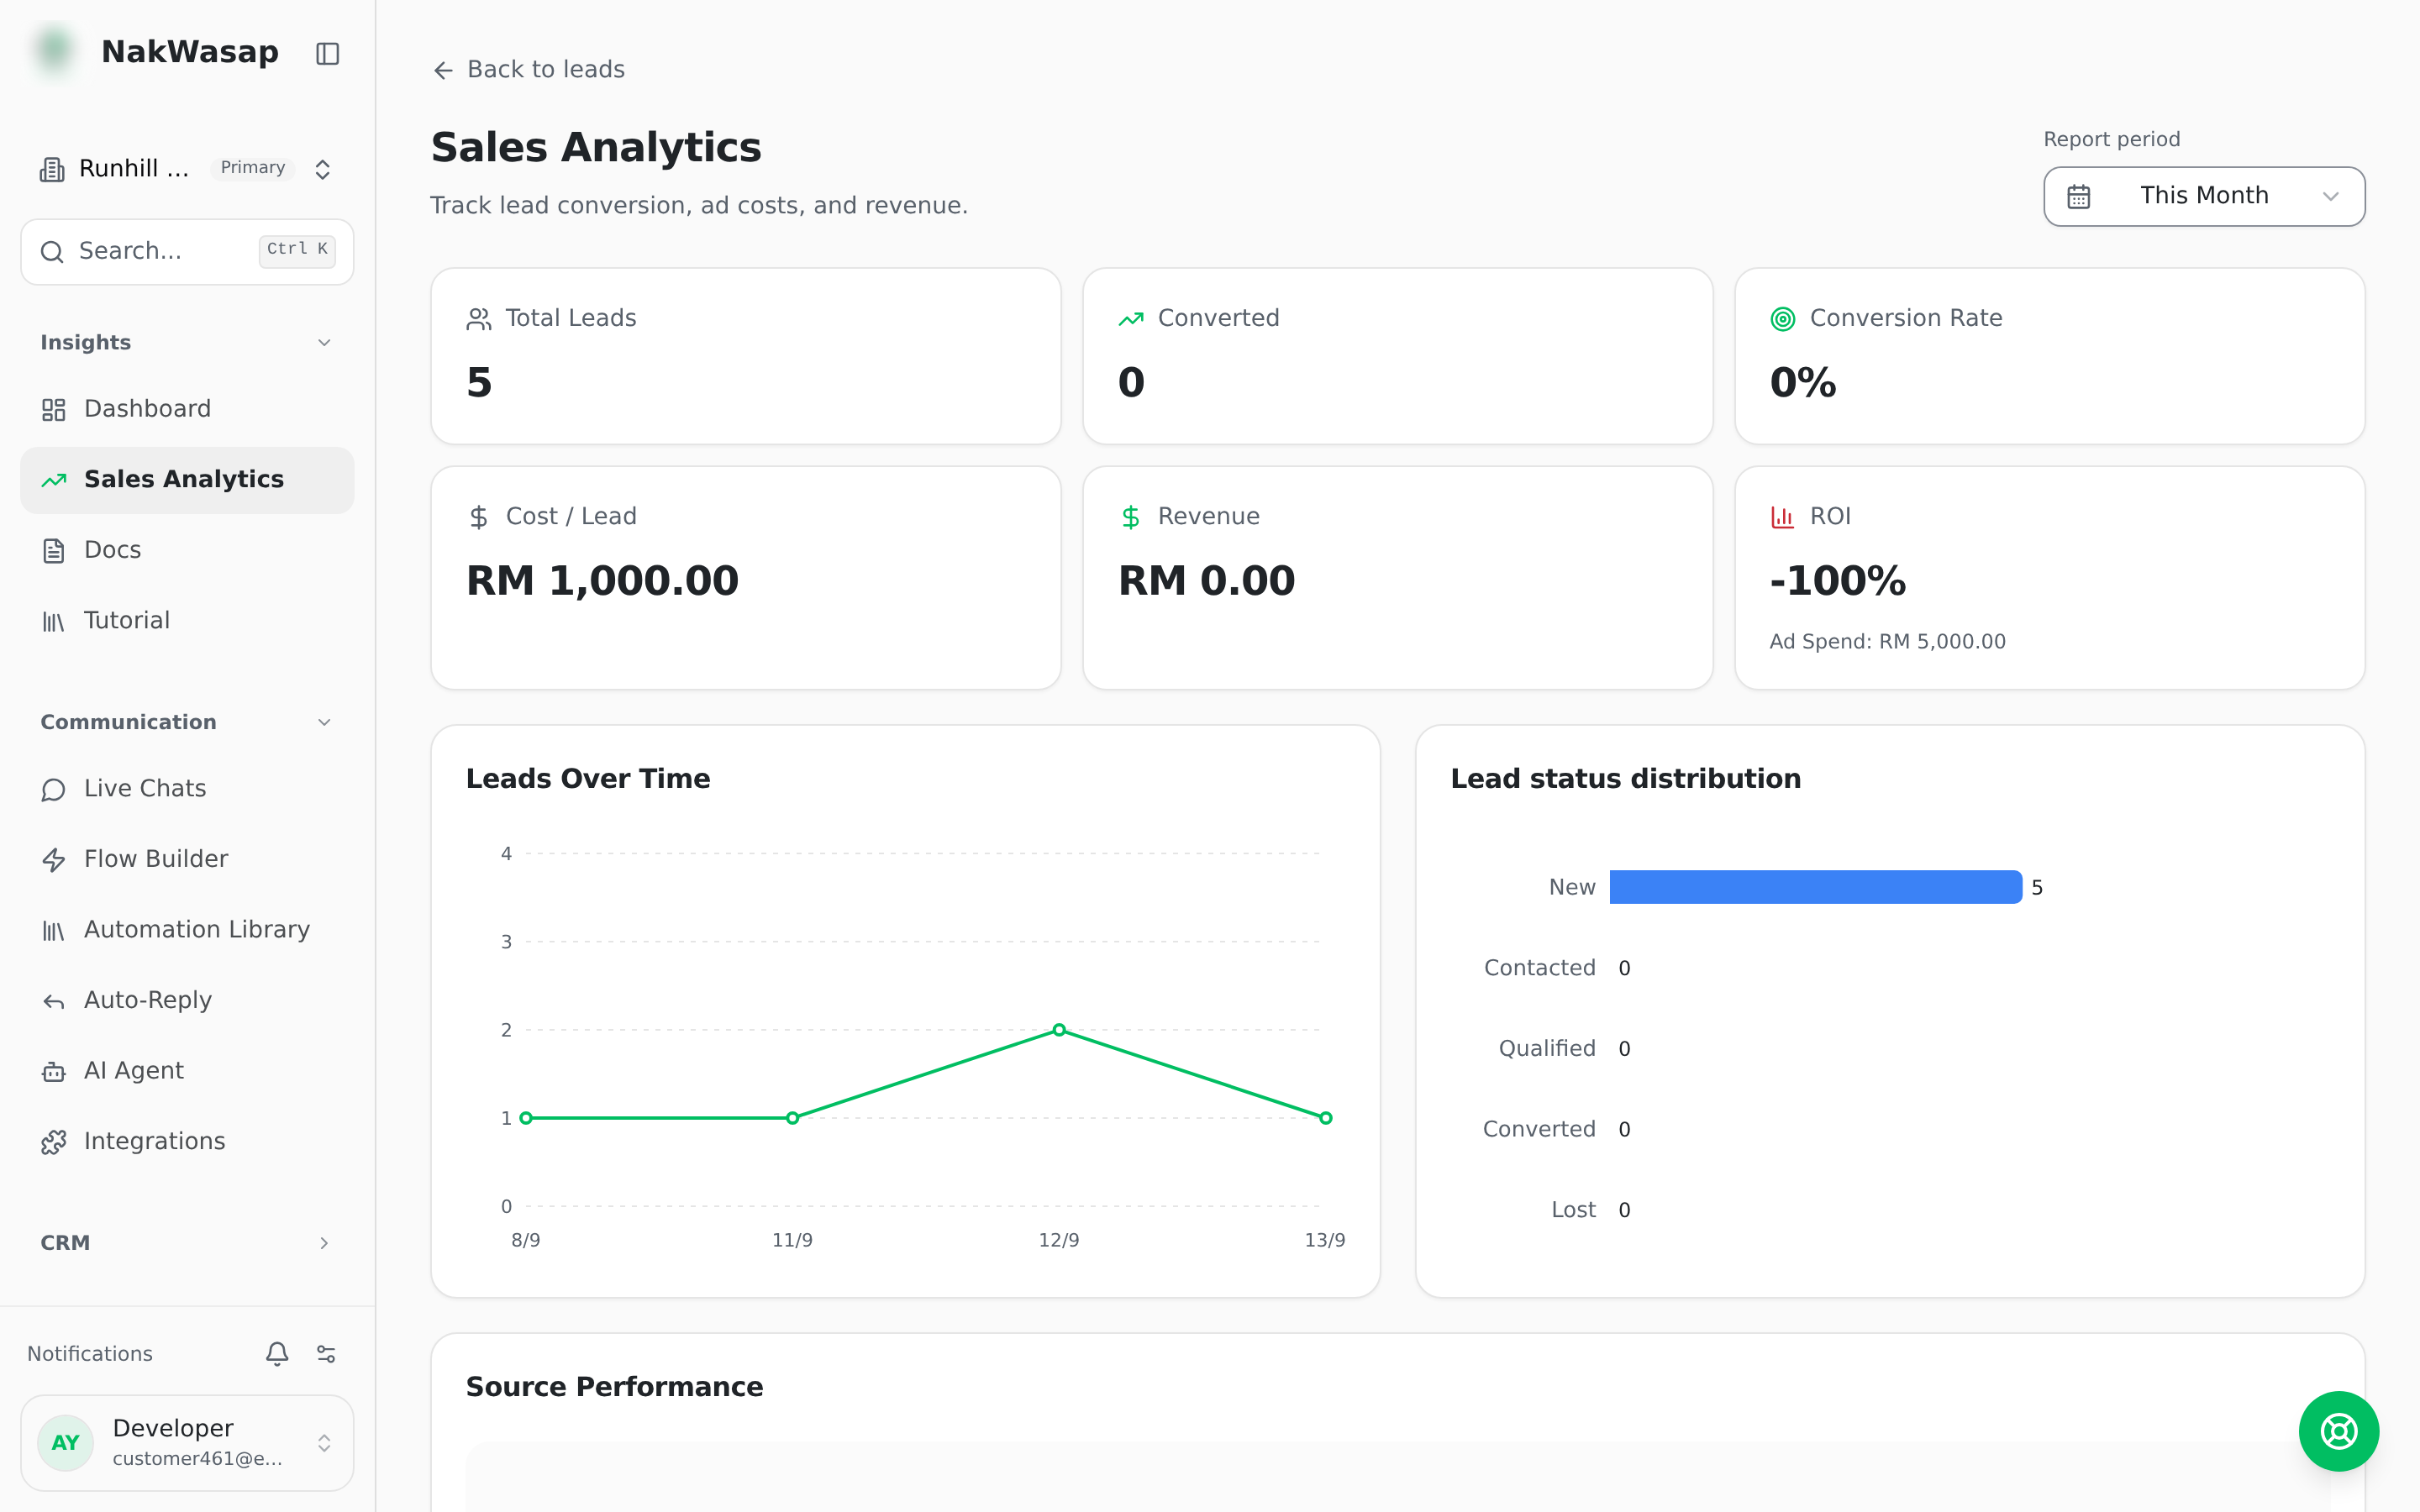
Pick a period — this month, last month, last 3 or 6 months, or all time.
Six tiles: total leads, converted, conversion rate, cost per lead, revenue, and ROI. Then charts for leads over time, status distribution, leads by source, and leads by agent with per-source conversion rates.
Cost and ROI come from the monthly spend you record under Ad Sources.
NextAuto-Reply→